|
ISO 12233 Test Chart
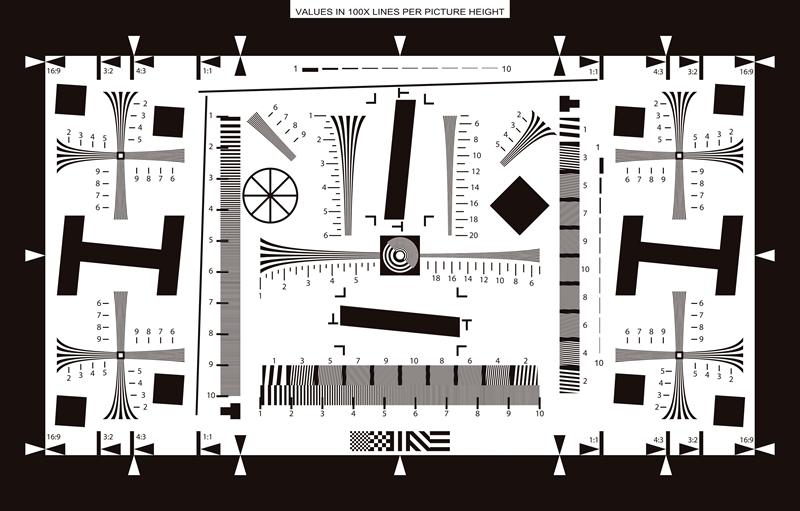
The
ISO 12233 Test Chart is
designed to measure the resolution of still
cameras,with resolution wedges up to 2000(enhanced 4000 lines)
lines per picture height. Furthermore it
contains slanted edges for SFR measurement.
On
the test chart marks for the respective picture size are arranged
(square = 1:1; usual digital format = 4:3,small picture = 3:2 etc.).
The camera has to be adjusted that the whole picture height is captured
an
the appropriate picture proportion is seen. The numbers at the lines
each mean “lines/picture height x 100”; e.g.12 =
1200 etc. Thus evaluation of a camera is possible with the aid of the
horizontal and vertical lines.
The
specified resolution should be the value in the center of the picture
on optimal conditions. Thus the quality of lenses, sensor and image
computation is evaluated simultaneously.
With
open iris end extreme zoom position the result can be worse. This has
to be tested and noted separately in the test report. Important is the
separate evaluation of resolution in the picture corners.
Color Rendition Chart (X-Rite ColorChecker)
Scan Reference Chart
Universal
Test Target
Critical
Flesh Tones Test Chart
Bar Test Chart(IEC 61146)
White Balacing Test Chart
ISO 12233:2014 Edge SFR(eSFR)Test chart
Color Spilled Coins (Dead Leaves) Test Chart
Gray Scale Test Chart(11 steps)
Streaking Measurement Test Chart
Color Bar Test Chart
Gray scale chart
Grid Test Chart
ISO 12233 Enhanced digital camera resolution chart
Standard SFRplus Chart
SFRplus Chart on Photographic Paper QI-SFR10-P-RM
ITE Grayscale Chart II(Gamma = 1)
Black & White Spilled Coins (Dead Leaves) Test Chart
OECF Test Chart (ISO 14524)
ISO 12233: 2014 (eSFR)Photographic chart
ISO-14524 digital camera contrast chart
ISO-15739 digital camera noise test chart
ISO 12233 Digital still-camera resolution chart
Automotive Test Chart
SFRplus Chart: Inkjet on Paper - 4:1 Contrast Ratio
SFRplus Chart: Inkjet on Paper - 10:1 & 2:1 Contrast Ratio
Distortion Grid Test Chart
HDTV Gray Scale Test Chart
ITE Grayscale Chart I(Gamma = 0.45)
EIA RESOLUTION CHART 1956
Sector Star Test Chart (72 cycles)
Sector Star Test Chart (36 cycles)
HDTV Universal Test Chart
DTV Color Rendition Test Chart
36-Patch Dynamic Range Test Chart
Spectrometer
OHSP-350
OHSP350A Light
Spectrometer
HPL-200
Flicker illuminometer
|
